Venuka Joseph
THE MARGINS DUDE — FREE BUSINESS ANALYSIS FOR LOCAL RESTAURANTS
I'm a 2nd-year Accounting & Finance student who also runs a restaurant — so I know the margins are tight and the hours are long. I offer free, no-obligation business analysis to local independents: what's selling, what's not, and where your costs are hiding.

About
I'm Venuka, a 2nd-year Accounting & Finance student at Leeds Trinity
University with an unusual head start: I run a restaurant myself,
so I'm not learning margins and menu costs from a textbook — I live
with them every week.I started The Margins Dude because I kept seeing the same problem
across small independents: owners are too busy running the
day-to-day to step back and actually look at their numbers. What's
really selling. What's quietly losing money. Where marketing spend
is working and where it isn't.I'm offering free business analysis to a handful of local
independents while I build a portfolio of real case studies — no
obligation, no sales pitch, just an honest look at what the data
says. If it's useful, great. If it's not for you, no hard feelings.Outside of this, I'm building toward a career in quantitative
finance — so if you're curious, this is also where I get to put
analysis into practice on real businesses rather than just theory.
WORK
PROJECT 1
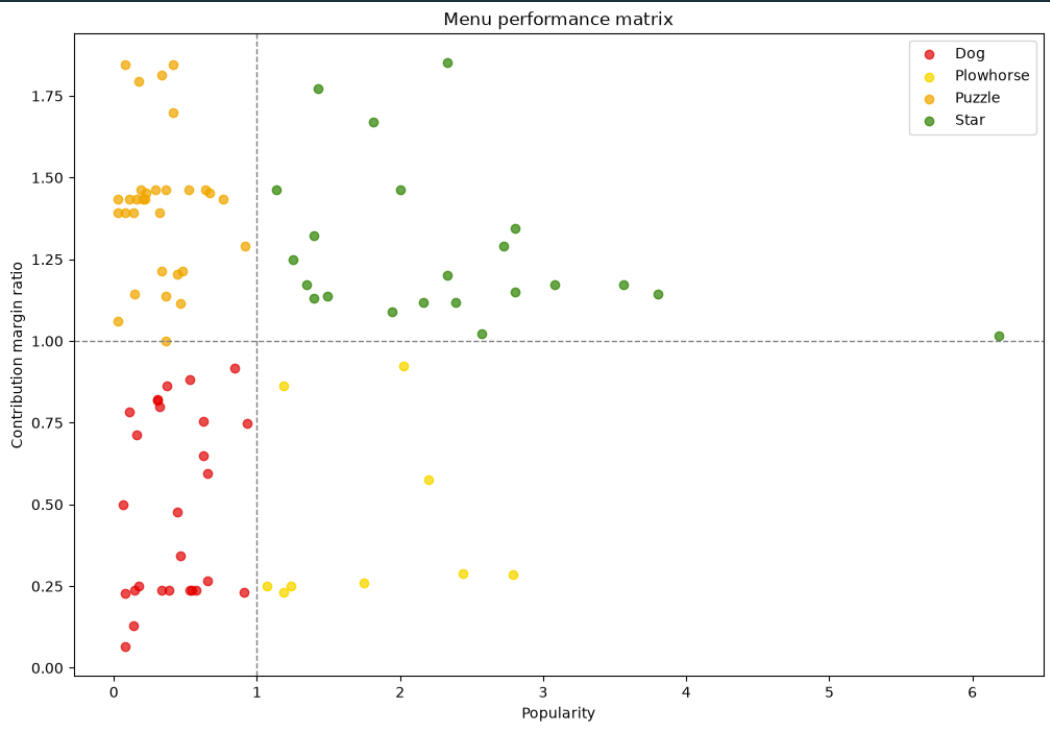
Menu Engineering: My Own RestaurantI started by cleaning two years of raw POS data — 601 individual
sales records — down to 89 standardised menu items I could actually
analyse. From there I built out contribution margin and popularity
index for every item on the menu, then classified each one using a
Stars, Plowhorses, Puzzles, and Dogs framework: which items are
both popular and profitable, which are popular but barely breaking
even, and which are quietly costing more than they earn.Rather than estimating food costs with a flat percentage across the
whole menu (the common shortcut), I costed by price-point clusters,
which gave a far more accurate picture of where margin was actually
being lost. The result was a clear, visual map of the entire menu —
what to promote, what to reprice, and what to quietly retire.This is the exact kind of analysis I'll run for your business:
real data, a clear framework, and recommendations you can actually
act on.
PROJECT 2
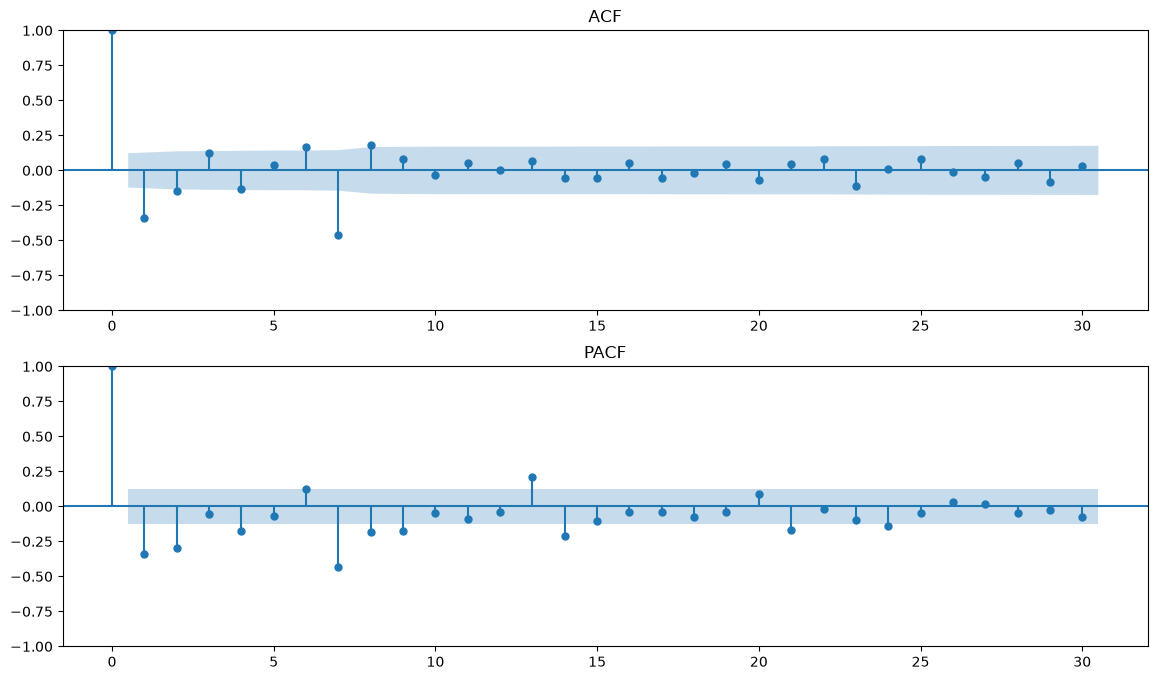
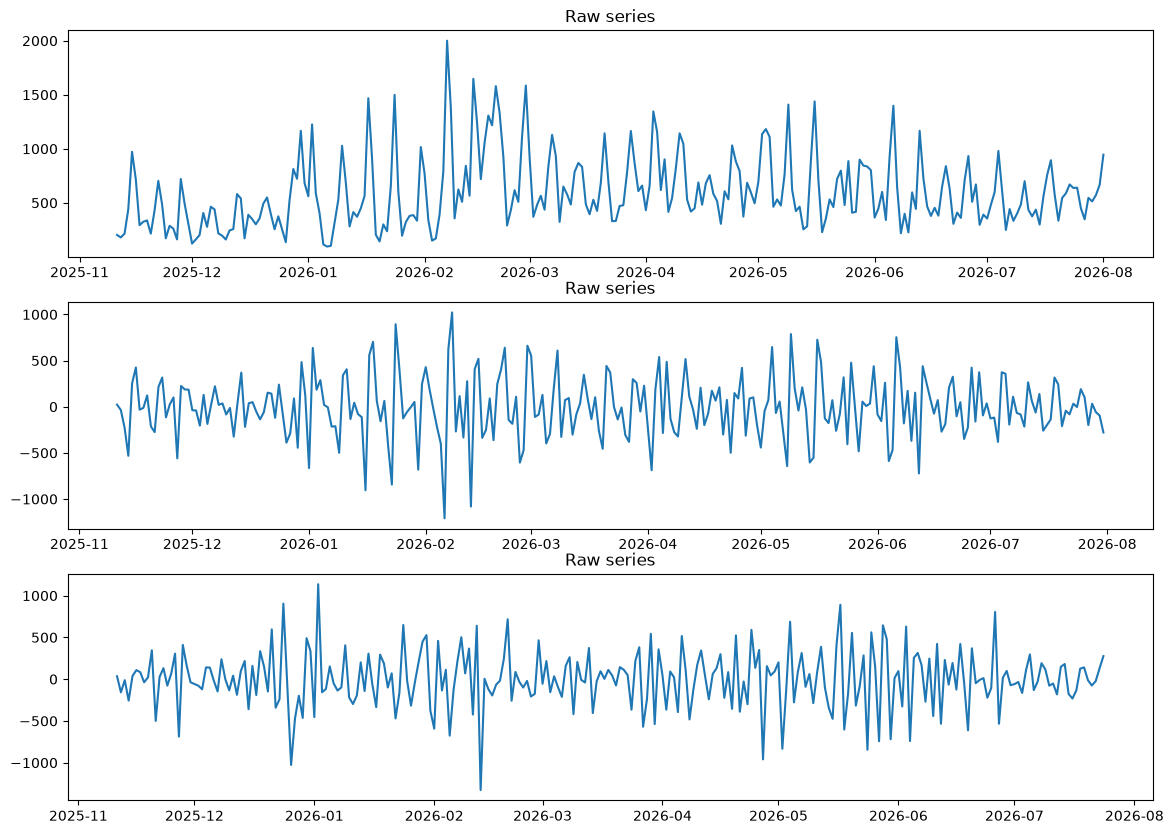
I started with 9 months of daily sales data and one basic question: how much of what we see week to week is the business actually growing, how much is just our normal weekly rhythm, and how much is noise that shouldn't drive any decision at all. Most owners can tell you weekends beat weekdays. Few can tell you by how much, in pounds, or whether last Tuesday's dip was a real problem or nothing at all.Rather than eyeballing the trend off a chart, I differenced the data to strip out both the drift and the weekly pattern, then ran autocorrelation analysis to confirm what was left. The result: a statistically significant, measurable weekly signal — proof of seasonality, not a guess. That structure now feeds a SARIMA model built to forecast short-term demand, with weather conditions being layered in next as a further predictive factor.The output isn't just a forecast — it's a way to tell a genuinely bad day from a normal one, and back every staffing or stock decision with a number instead of a feeling.This is the exact kind of analysis I'll run for your business: real data, a clear framework, and recommendations you can actually act on.